Table of Contents
W03 cell
2009-02-05 Intro
In which I write at length of my long personal quest for periodic enlightenment.
Ok, at long last I have starting putting effort into the (alpha, gamma) = (1.14, 2.5) a.k.a. W03 (Waleffe Phys Fluids 2003) or narrow cell again. This was prompted by a comment by Roman in class a couple weeks ago about relative ease of finding EQBs and POs in HKW (Hamilton et al JFM 1995) vs W03 cells and a recommendation from Predrag to begin our periodic orbit paper (in development) with the W03 cell, whose state-space structure we understand a little better. Plus, previous results suggested that the two orbits we had for W03 were perturbations of each other (a short one P35.86 and a long one P97.08 that was like the short one plus an extra wiggle).
I computed these orbits way back in summer 2007 just before going to India. Yikes! That was the very beginning of my orbit-computing days. The 97.08 orbit was not very well converged (|f^t(u) - u| = 5e-3 compared to 1e-8 for the other), and I didn't have a good enough sense of these computations to know what the problem was and whether I really had an orbit or not. So I went on to hone my orbit-finding chops on easier problems (HKW, where good initial guesses are plentiful). And doing this, in India and more recently, I uncovered several problems in my implementation of trust-region heuristics that might have prevented P97.08 from converging.
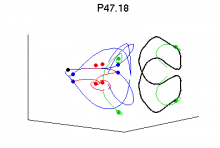
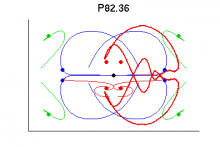
Anyway back to the present. Over the last couple weeks I have run maybe thirty orbit searches in the WO3 box on initial guesses from moderately long-lived trajectories from perturbations of equilibria, plus the pre-India P35.86 and P97.08 orbits. P35.86 converged more precisely and is now renamed P35.77. PACE is still pounding on P97.08 and has the residual down to 1e-3, after about a hundred Newton-hooksteps. But I have found several other orbits to double precision (for a given discretization). Here are some pics.
In the pics:
- The black dot is laminar flow
- The blue (green) dots are Nagata lower (upper) branch eqbs (Nagata JFM 1990)
- Red dots are EQ4 a.k.a “newbie” equilibrium from our recent JFM papers
- Thin (blue, green, red) lines are trajectories in low-d unstable manifolds of (Nagata LB, Nagata UB, EQ4)
- The thick lines are the periodic orbits
- Projection is same as in most figures in Gibson et al. JFM 2008
And some properties. Will add eigenvalues when they're done cooking.
| T | σ | <D> | |Λ|>1 | max |Λ| | max Re λ | |Λ|S >1 | max |Λ|S | max Re λS |
|---|---|---|---|---|---|---|---|---|
| 35.77 | Lx/2 | 2.78 | 19 | 13.0 | 0.072 | 5 | 2.5 | 0.026 |
| 50.16 | 2.32 | 19 | 26.9 | 0.040 | 5 | 26.9 | 0.040 | |
| 82.36 | Lx/2 | 1.90 | 5 | 63.7 | 0.050 | 2 | 63.7 | 0.050 |
| 83.60 | 2.21 | 8 | 57.6 | 0.049 | 3 | 9.1 | 0.026 |
- Λ is the characteristic multiplier of the map u → σ fT(u), computed with Arnoldi iteration.
- The |Λ|>1 column gives the number of unstable characteristic multipliers.
- Re λ = 1/T ln(|Λ|) is a continuous-time measure of the orbit's instability.
- Quantities with S subscripts are restricted to the set of eigenvalues with S = {1, s1, s2, s3} symmetry. See symmetry.
2009-02-08 Movies of periodic orbits
2009-02-16 Desymmetrization
Modding out the 4th-order discrete symmetry: The 3D projections above are onto basis functions {e0,e1,e2,e3} that are symmetric and
antisymmetric in the half-cell shift translation symmetries  .
.
2009-03-17 Poincare section
Here's a first shot at a Poincare section through the Nagata upper branch. The unstable complex eigenvalue is λ = 0.03253 +/- 0.1070, giving a period of T=58.72 and a characteristic multiplier over that period of Λ = 6.7545. The orthonormal basis e0,e1,e2,e3 is formed from the complex instability (the plane of e0,e1) and the most weakly stable of the remaining eigenvectors in the S-invariant subspace. I seeded N=16 trajectories along direction in the plane of complex instability

with ε = 1e-05 and integrated them for 300 time units, chosen since 1e-05 exp(300 Re λ) is about 0.2, roughly the maximum distance observed in the state space. The Poincare section shown is defined by the condition

where

I used a small nonzero value of θ so that trajectories started slightly before the Poincare section, rather than before or after by +/- 1e-14 floating point rounding error, which would have caused a few section points to go missing. Crossings were calculated by quadratic interpolation between successive time steps that pierce the section. As solutions of Navier-Stokes dynamics the interpolation accuracy between steps spaced by dt is the same as the accuracy of the time-stepping algorithm (O(dt^3)). The interpolated fields met the Poincare condition to floating-point accuracy.
Prior to checking for section crossings, the field u(t) was translated by half-cell shifts into the canonical first quadrant defined by

where ex and ez are the x and z antisymmetric basis elements of the UB (EQ2) translation basis of our 2008 JFM paper.
Factoring out the 4th-order discrete translation group this way introduces discontinuities in the unstable manifold. Red / blue signify ingoing / outgoing crossings of the section. The open dots are the crossings of the P47p18 periodic orbit. Orientation of the red sections is the same, but the blue sections are reversed. I think this is just an artifact of the projection since it doesn't make sense dynamically.
Much is left to be done of course: getting a more completepicture of the discontinuous sections of the unstable manifold, coordinating the unstable eigenvalues of theperiodic orbit with the EQ2 unstable manifold, looking at the same picture for various values of theta, coordinating these results with previous images of the EQ2 unstable manifold.
Dustin, I hesitated to do this because I know it's your project, but there was a fair amount of coding involved, so I'm glad I went ahead and did it. There is still tons to do. I will make notes tomorrow on exactly how I did the calculations and provide you with the needed code.
2009-03-18 EQ2 eigenvalues, full space
More slice and dice: the eigenvalues for EQ2. ASA symmetry, for example, means antisymmetry in s1 and s3 and symmetry in s2.
| n | Re λ | Im λ | symmetry |
|---|---|---|---|
| 1 | 0.05558362 | 0 | AAS |
| 2,3 | 0.03252919 | 0.107043 | SSS |
| 4,5 | 0.01606001 | 0.03923802 | SAA |
| 6,7 | 0.01529245 | 0.2841767 | SAA |
| 8 | 0.01060338 | 0 | ASA |
| 11,12 | -0.01412172 | 0.05774757 | SSS |
| 13 | -0.01818171 | 0 | SAA |
| 14,15 | -0.02091932 | 0.1735921 | AAS |
| 16,17 | -0.02429506 | 0.1479473 | SSS |
| 18,19 | -0.02646826 | 0.3121915 | ASA |
| 20,21 | -0.02741331 | 0.147147 | AAS |
| 22,23 | -0.02936277 | 0.1387544 | SSS |
| 24,25 | -0.0303013 | 0.2516945 | ASA |
| 26 | -0.03073016 | 0 | ASA |
| 27,28 | -0.03770692 | 0.1986541 | AAS |
The 2,3 eigenvalues have a period of 58.7 and a multiplier of 6.75. The next SSS eigenvalue pair 11,12 has a multiplier of exp(-0.0141*58.7) = 0.437 in that period, which is not very strongly contracting. There's roughly a factor of three between the most expanding SSS direction and the next, most weakly stable.
2009-03-18 more on desymmetrization
I don't think the double-theta trick that works for desymmetrizing Lorenz will work for S-symmetric plane Couette.
This trick factors out a  symmetry in Lorenz –an
orientation-preserving rotational symmetry.
In S-symmetric plane Couette we have a fourth order symmetry that equates  .
(Here I am letting x stand for all the τx-antisymmetric coordinates in the plane Couette state space, etc.)
The double-angle trick would collapse the pair (x,y,z) and (-x,y,-z) (in this case we'd apply it in x,z rather than x,y), and also the pair (-x, y, z) and (x,y,-z), but it won't connect (x,y,z) to (-x,y,z) or (x,y,z) to (x,y,-z), which are related by a mirror symmetries. And it's the (x,y,z) to (-x,y,z) connection we are particularly concerned with, since the P47p18 orbit goes back and forth between EQ2 and τx EQ2.
2009-03-20 and more...
Also, I don't see how to avoid introducing discontinuities when mapping into a canonical quadrant. In PCF, you have many τx antisymmmetric coordinates. Label them (x1, x2, x3, …). Same with z. The trouble is these coordinates cross zero independently. So if you define the canoical 1st quadrant to be x1 ≥ 0 and z1 ≥ 0, and you apply τx when x1 goes from positive to negative (etc), the x1 coordinate is continuous, but all the other nonzero x coordinates change sign, too, and thus undergo finite jumps.
2009-03-24 more poincare sections
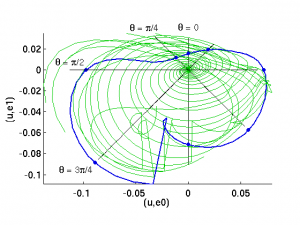
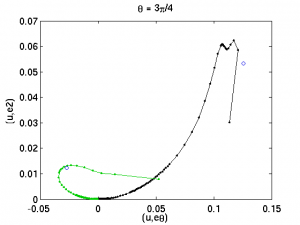
Above shows our old friend the Nagata upper branch EQ2 (at the origin) and its S-symmetric 2D unstable manifold in green along with the P47p18 periodic orbit in blue. The 4th-order translation symmetry has been factored out as described above. The projection is onto a 3D basis, of which e0,e1 span the complex instability and e2 is (EQ2 - τx EQ2) with the components parallel to e0,e1 removed. The reason for this choice of basis is that the dynamics in this region seems to be governed by the complex instability and flopping back and forth between EQ2 and τx EQ2. I am game for suggestions of other basis sets. Once the sections are computed (as codim-1 slices orthogonal to e(θ) = e0 cos θ + e1 sin θ), it takes 2 or 3 hours to compute a low-d projection of the section, make the plots, and post them.
Poincare sections, in black, have been computed at several orientations marked by values of θ. Factoring out the discrete translation translation symmetry introduces discontinuities in trajectories as described above. I kept the abrupt line segments marking these discontinuities in the plot, even though they aren't strictly part of the trajectory, because they help you seen how the jumps are connected.
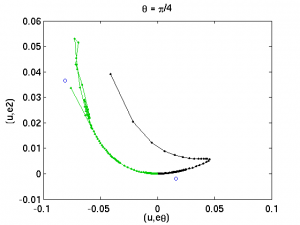
The four plots above are the 2D Poincare sections with horizontal axis at various orientations in the e0,e1 plane and the vertical axis along e2. Each plot corresponds to a marked value of θ in the 3D plots above. The black portions are “ingoing” trajectories, which are on the side of the section where θ is labeled in the 3D plots (for the most part). The green portions are “outgoing” trajectories on the other side. The blue circles mark the crossings of the the P47p18 periodic orbit.
These pictures are nice to look at but I'm not sure how much we can take away from them. You can't necessarily interpret an apparent fold in these sections as the classic nonlinear stretch and fold scenario, like in Rossler or Lorenz. It is true that an apparent fold, like the black part of the θ=0 section, shows that the unstable manifold has stopped stretching in the θ=0 direction and has returned back to lower values of (u, eθ). However, we can't attach too much meaning to the vertical axis. That “fold” could be a very gentle curvature in the full space, and the portion of the unstable manifold that appears to be right above EQ2 (the origin) could be way, way far away from it, in directions we've projected out.
2009-03-26 EQ2 eigenvalues, S-invariant subspace
| n | Re λ | Im λ | T-multip | symmetry |
|---|---|---|---|---|
| 1,2 | 0.03252919 | 0.1070431 | 6.75 | SSS |
| 3,4 | -0.01412161 | 0.05774779 | 0.447 | SSS |
| 5,6 | -0.02429575 | 0.1479471 | 0.240 | SSS |
| 7,8 | -0.02936259 | 0.1387545 | 0.178 | SSS |
| 9,10 | -0.05782164 | 0.2838004 | 0.0336 | SSS |
| 11,12 | -0.0620747 | 0.2420612 | 0.0262 | SSS |
| 13,14 | -0.06761083 | 0.2166657 | 0.0189 | SSS |
| 15,16 | -0.07723642 | 0.08462713 | 0.0107 | SSS |
| 17,18 | -0.1008762 | 0.2608582 | 2.6e-03 | SSS |
| 19,20 | -0.1023387 | 0.1500897 | 2.4e-03 | SSS |
| 21,22 | -0.1068182 | 0.1773124 | 1.8e-03 | SSS |
| 23,24 | -0.1090364 | 0.02625084 | 1.6e-03 | SSS |
| 25,26 | -0.1114009 | 0.0739416 | 1.4e-03 | SSS |
| 27 | -0.1118931 | 0 | 1.4e-03 | SSS |
| 28,29 | -0.1134904 | 0.1401729 | 1.2e-03 | SSS |
The 1,2 eigenvalues have a period of 58.7 and a multiplier of 6.75. The next SSS eigenvalue pair 3,4 has a multiplier of exp(-0.0141*58.7) = 0.437 in that period, which is not very strongly contracting. There's roughly a factor of three between the most expanding SSS direction and the next, most weakly stable.
2009-04-06: added characteristic multiplier for period T=58.7 for each eigenvalue. mult = exp(57.8 Re λ)
2009-04-10 Poincare sections 3
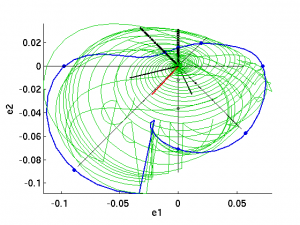
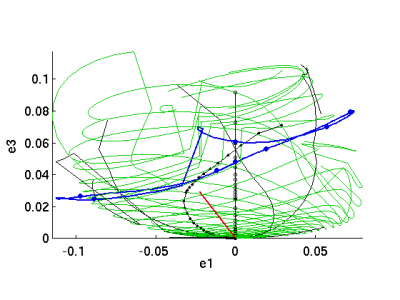
The figures show the unstable manifold of EQ2 (the Nagata upper branch) projected onto an orthogonal basis set spanning the leading three eigenfunctions in the S-symmetric subspace, whose eigenvalues are listed above. e1, e2 span the complex instability λ = 0.0325 + i 0.1070 (n=1,2 in the above table). e3 is the component of the real part of the most weakly contracting eigenfunction (n=3,4 above, eigenvalue λ = -0.0141 + i 0.0577) that is orthogonal to e1,e2. That sets an arbitrary choice of orientation within the plane of the n=3,4 oscillation; it would perhaps be better to make the third coordinate in the plots below be the norm of the projection in this plane, or even the distance from u(t) to the e1,e2 plane. I will try that later.
The green trajectories are in the unstable manifold of EQ2, and the blue orbit is P47p81. The short, thick black lines are the real and imaginary parts of the n=1,2 eigenfunctions. The short think red line is the real part of the n=3,4 eigenfunction. The long thin black lines are intersections of the unstable manifold with Poincare sections placed at θ = 0, pi/4, pi/2, 3pi/4, etc. The θ = 0 section is marked with small circles and the θ = pi/4 with dots.
2009-04-13 Poincare sections 4
Here we have the poincare sections at θ=0 (black, and θ=π in green). The left plot repeats one shown immediately above, the right plot is the same but showing only the intersections with the Poincare section. The discontinuities in the unstable manifold are due to factoring out the 4th-order discrete translation symmetry. For any given state u(t), we apply whichever half-cell translation τ in {1, τx, τz, τxz} puts τ u(t) in the first quadrant of the four-fold symmetric pictures above, that is meets the conditions

Same as above but with the Poincare section at θ=π/2 (black) and θ=3π/2 (green).
The θ=0 section above looks potentially fruitful. It could be that the unstable manifold is folding back on itself due to the desymmetrization. Or it could be an artifact of the projection due to the arbitrary choice of the third (vertical) axis in the plots, e3. I will plot a few other projections of the same section to see. 2009-04-13 11:40 EST
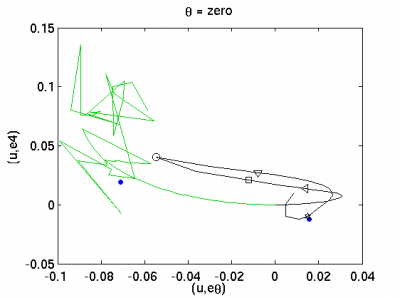
Ok, some Poincare sections at θ=0 orientation, with vertical axis (u, e3) on left and (u, e4) on right. e3, e4 are the orthogonal components of the real/imaginary parts of the n=3,4 eigenfunction, respectively. I have marked a few points on the unstable manifold with symbols so they can be compared between plots. Next is to assign arclengths along unstable manifold and plot a return map. This involves some more arbitrary decisions, namely, when to continue increasing arclength and when to project back onto previous portions of the unstable manifold. 2009-04-13 12:07 EST
The plot above shows a number of points on the unstable manifold and their iterates under the return map. A triangle symbol maps into the next triangle out along the unstable manifold, etc. The symbols are, in sequence, triangle, square, diamond, star, circle. The first iterates of the symbols are all clustered just to the right of EQ2 (at the origin). One return later they are spread from the triangle at (0.03, 0.03) to the circle at (-0.01, 0.08). The next return, they are all over the map, and it no longer makes sense to draw lines connecting them (though I have done so to show you that I am insane).
This is bad news, I believe. In order for the approximate return map s^(n+1) = f(s^n) (where s is pseudo-arclength along the unstable manifold) to produce good guesses for periodic orbits, it needs to intersect the identity. has to intersect the identity. In this plot, that would correspond to some portion of the lower part of the fold to be mapped into the upper part. But the symbols show us this doesn't happen.
Corrections? Suggestions?
John Gibson 2009-04-13 14:52 EST
2009-04-27 PC
Can you plot these sections in desymmetrized space of Gibson et al?
It should be easier to visualize them without discontinuities… — Predrag Cvitanovic 2009-04-27 07:53
2009-08-05
I think the problem is not with the visualization but with the rapidity of stretching of the EQ2 unstable manifold, demonstrated by the motion of the symbols along the Poincare section of EQ2 shown above. But I agree that the discontinuities are a distraction. I was plotting in eigenfunction-based coordinates to try to more clearly illustrate the relation of the stretching and folding of the EQ2 unstable manifold with its eigenfunctions.
However in the meantime I think I've gotten a better idea of where this is going, with the Poincare sections. I have refactored my poincare-section code over the last few weeks to be more flexible. My last approach ended up requiring some pretty horrific shell work to massage the Poincare section data into manageable form. Now I have a command-line utility that will integrate from one crossing to the next, with the fundamental-domain mappings happening when they need to, and saving incremental data along the way for plotting. I think I can modify Arnoldi and Newton-Krylov algorithms without too much trouble so that they operate on section-to-section mappings. That will enable me to investigate the unstable manifolds of EQ2 and P48p18 orbits in a more canonical manner (e.g. like the Henon map in chaosbook).
I will restart with plots in which there are no discontinuities. Plots are coming.
2009-08-06
For now I will try to make progress understanding the EQ2 and P47 unstable manifolds via Poincare sections in a fundamental domain defined by a1 > 0, a2 > 0, where these are the coordinates in EQ2-translation basis, rather than using the nonlinear coordinate transformation from a → (a^2 - r^2)/r^2 as suggested above. Let me get some confidence in my Poincare section technology, and then I will apply it with a nonlinear coordinate transformation later, if that still seems sensible.
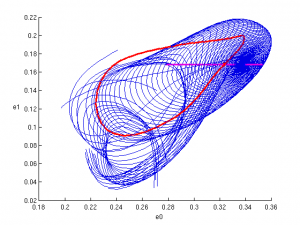
Here's a familiar picture of trajectories in the EQ2 unstable manifold viewed in an EQ2-translational basis. The blue trajectories are straight DNS integrations, the red are using some new code that applies a translation operation to u(t) and the DNS whenever it hits a boundary, and then computes Poincare section crossings on the trajectory restricted to the fundamental domain. The bold lines show the P47.18 periodic orbit, global (blue) and fundamental domain (red).
The plots above are now restricted to the fundamental domain. The e0,e1,e2,e3 axes are the EQ2-centric translational basis, with zero-based indices (which are better for me computationally than one-based). The dots are intersections of trajectories with a Poincare section defined by (u(t)-EQ2, e1) == 0, with that quantity decreasing as it passes through zero. These plots are only orientation for what's coming. Also, I should note that the discretization here is really low in order to speed up the computations during development and testing phases, 32 x 33 x 32 (or 24 x 33 x 24 Fourier-Chebyshev modes, when you take dealiasing into account). Coefficients of order 1e-4 are getting cut off. EQ2 and P48p18 converge just fine on this smaller grid, but, for example, the period of the orbit differs in the fourth digit. When I encounter differences with greater sensitivity to discretization, I will note them.
2009-08-11
Further steps towards analysis of poincare section cutting EQ2 and P47. Have refined the integrations in order to get better resolution on the poincare section of the EQ2 unstable manifold. Blue lines are trajectories in 2d unstable manifold of EQ2. Red line is P47 orbit. Purple line is intersection of EQ2 unstable manifold w poincare section. Blue dot is EQ2. Red dot is P47 intersecting Poincare section. Projections, fundamental domain described above. Next step is to calculate the eigenvalues and eigenfunctions of P47's fixed pt in the poincare map and commpute P47 unstable manifold in poincare section.
Later p.m. news: have successfully recomputed P47 as a fixed point of the Poincare section map. Next step, eigenvalues and eigenvectors of the map about P47.
2009-08-12
Have computed eigenvalues of Poincare map about P47. The leading eigenvalues compare reasonably well to the eigenvalues of the orbit unconstrained to the section, but there are a large number of marginal eigenvalues and I suspect something is wrong, possibly sensitivity of Arnoldi to the way that data is fixed to lie on the Poincare section numerically. There are also differences between the maps and the discretization of the current computation is lower. I will recompute the eigenvalues of Poincare map and orbit in both discretizations.
| Poincare map | Orbit | 123 | ||
|---|---|---|---|---|
| abs λ | arg λ | abs λ | argλ | |
| 21.68 | 22.60 | SSS | ||
| 9.256 | 9.254 | AAS | ||
| 4.784 | π | 4.795 | π | SAA |
| 2.302 | π | 2.301 | π | SSS |
| 1.874 | 1.873 | ASA | ||
| 1.808 | 0.47 π | 1.810 | 0.47 π | SSS |
| 1.808 | -0.47 π | 1.810 | -0.47 π | SSS |
| 1.4618 | 1.462 | AAS | ||
| 1.065 | π | 1.065 | π | SAA |
| 1.012 | 1.006 | 1e-04 | ||
| 1.0003 | 1e-04 | 1.006 | -1e-04 | |
| 1.0003 | -1e-04 | 1 | ||
| 0.9999 | 0.8577 | 1 | ||
| many | ||||
| more | ||||
| marginal | ||||
update 2009–08-14: the orbit eigenvalues in the table are now at the same discretization as the poincare map.
PC: as to the next step: instead of computing the P47 unstable manifold in Poincaré section I suggest parametrizing the EQ2 unstable manifold section in terms of arclenght, and studying how far iterates of points on it get from it in one iteration. If we are lucky, backfolding is strong enough to enclose the P47 fixed point within the first fold.
JFG: Check out poincare_sections_4. This has symbols marking successive iterations of points along the EQ2 unstable manifold. Motion outwards along unstable manifold is very fast, and folding is hard to understand in so many dimensions. I was trying there to make folding clearer by plotting in non-orthogonal eigenfunction coordinates (two coords for the plane of complex oscillation, third being the weakest contracting direction). I think we need to understand what constitutes folding before making a return map along the unstable manifold arclength. Separation along only contracting directions makes sense as a definition of a fold, but detecting that in practice I don't have much sense for right now.
2009-08-14
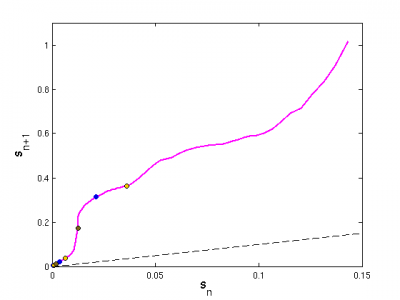
(right) An arclength return map (purple) along the unstable manifold of EQ2 within the Poincaré section shown above. The dashed black line is the identity. Note that this is strict arclength, not pseudo-arclength (in which “folded” parts of an unstable manifold are projected back onto prior parts of the manifold), since I have not yet detected a fold and am not sure one even exists. The colored (orange, brown, blue) dots show successive iterates along the unstable manifold: for example, an orange dot maps into the next-furthest-out orange dot under one iteration of the poincare map. (left) the same dots shown on the state-space portrait of the Poincaré section.
Comments: The initial slope of the return map is 6.43, roughly the same as the expansion factor 6.74 predicted by the complex eigenvalue of EQ2. The initial magnitude of the perturbation is fairly large (1e-03), so the discrepancy does not worry me.
PC: I think there is no need to actually compute the eigenvalues from the numerically computed Poincaré section, but it is comforting to check that the leading ones are in the right ball park. We know that they are the same as for the flow except for the one marginal along the time-evolution direction, which is eliminated by the section. The corresponding eigenfunctions for the expanding directions can be obtained by projecting the full space ones onto the Poincaré section tangent space at the point of the section.
JFG: If there is any folding going on in this unstable manifold, it is not obvious to me. Next I think I'll make a plot of |u_n - u_m|, or maybe just |u - u'| for u' = f(u) to see if there is any hint of folding. I realize that it would be better to compute distance only along unstable directions, but I am pretty sure that we are sufficiently far from the equilibrium that contracting vs expanding directions are unknown, and even if we were, the decomposition into stable versus unstable directions is not a trivial matter.
PC: I am not hopeful about folding back in the unquotiented statespace - there one might have only forward short-flight maps, from neighborhood to neighborhood - but I hope that in the Z_2 quotiented representation there is a return map that captures your short periodic orbit bouncing between the unstable Upper Branch equilibrium and its symmetry translate. |u(t) - u(t')| plot in the (t,t') plane for pairs of points on the unstable manifold (where distance is the energy norm measured in the Z2 quotiented statespace) sounds like a good idea for detecting any significant backfolding of the unstable manifold. You also have some intuition where the unstable manifold bends from your published 2-d projections of the unstable manifodl and it's symmetric sister.
JFG: These plots have the discrete symmetry quotiented out. The fundamental domain is one quadrant of the full space, with trajectories mapped back into the fundamental domain by translation whenever they exit. I have to run at the moment but the description of the quotiented should be described in detail above. update The quotienting is described and illustrated in my 2009-08-06 entry


