Table of Contents
Math 445 Lab 6: 3D graphics
Important matlab commands: linspace, meshgrid, pcolor, surf, contour, surfc, contourf, quiver, mesh, load, subplot, pcolor, shading.
Problem 1: pcolor, meshgrid, shading, subplot
Skim the Matlab documentation for linspace, meshgrid, and pcolor. Create a 2D mesh from −π to π with 30 points in both the x and y directions. Then for each position in the mesh let z = cos(x) sin(y). Use pcolor, axis equal, and axis tight to generate this figure:

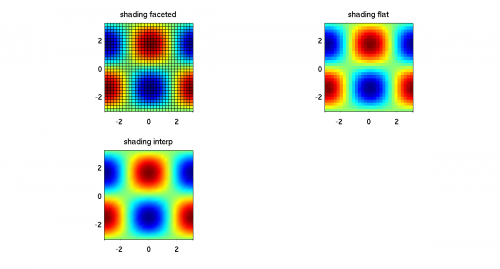
But don't you hate those ugly black lines? You can get rid of them with the shading command. Use subplot and the shading command to generate this figure:
Problem 2: surf
Create a 2D mesh from −π to π with 20 points in both the x and y directions, let z = cos(x) sin(y) pointwise, and then recreate this figure using the surf and colorbar commands.

Problem 3: surf in the shade
Create a 2D mesh from −10 to 10 with 100 points in both the x and y directions,
let  and
and z = 5 sin(r)/r. Then recreate Figure 4 using the surf and shading commands.

Attribution: based on Prof. Mark Lyon's “Advanced Graphics” lab for Math 445, which was adapted from an Octave demo.
Problem 4: surf 'n' subplot
Create a 2D mesh from −π to π with 100 points in both the x and y directions and
then recreate Figure 5, using the functions z = cos(x/2) cos(y/2), z = sin(x) cos(y/2),
z = cos(x/2) sin(y), and z = sin(x) sin(y).

Problem 5: mystery plot
Enter the following code into a script file, save the figure produced as a '.jpg' or '.png' image, and include it with your project. What does the image produce? What is the role of the 'C' variable?
[phi,theta] = meshgrid(linspace(0,2*pi,100));
X=(cos(phi) + 3) .* cos(theta);
Y=(cos(phi) + 3) .* sin(theta);
Z=sin(phi);
C=sin(3*theta);
surf(X,Y,Z,C)
shading interp
Bonus
Draw a Klein bottle in Matlab. Feel free to search the web, but understand whatever you use.
Attribution: This lab is adapted from Prof.Mark Lyon's Math 445 Advanced Graphics lab, which is adapted from Octave demos at http://yapso.sourceforge.net/demo/demo.html.
